Error and attack tolerance of complex networks
November 20, 2024 | 869 words | 5min read
Paper Title: Error and attack tolerance of complex networks
Link to Paper: https://www.nature.com/articles/35019019
Date: 27. July 2000
Paper Type: Internet, Networks, InfoSec, Cybersecurity, Resilience, Attacking, Topology
Short Abstract:
The authors of this paper investigate the resilience of complex networks, such as the internet, to errors and targeted attacks. They demonstrate that this resilience is not a universal property of all distributed networks but is instead characteristic of inhomogeneous networks.
1. Introduction
The increasing availability of topological data from large networks has led to a better understanding of their structure and behavior.
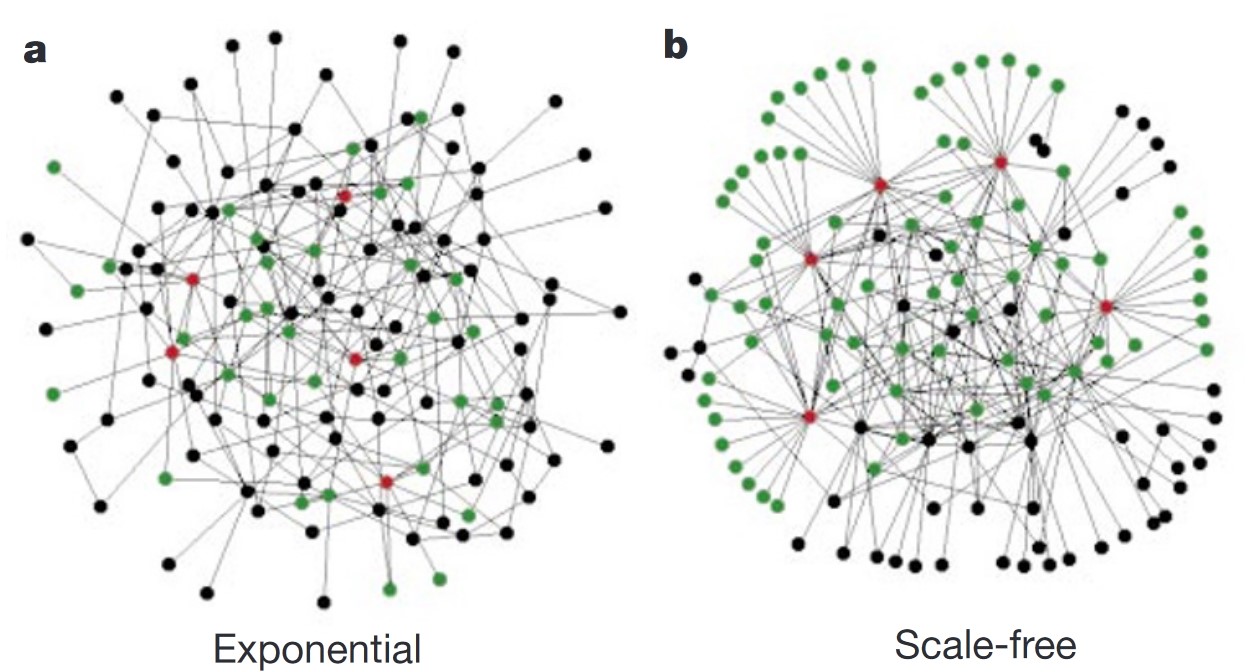
Empirical and theoretical results have shown that large networks can be classified into two main types:
- Graphs with a homogeneous degree distribution, such as the random graph model by Erdős and Rényi.
- Graphs with an inhomogeneous degree distribution, examples of which include Geometric Inhomogeneous Random Graphs (GIRGs) and the World-Wide Web.
The World-Wide Web and the Internet belong to a class of graphs called scale-free networks. In these networks, the fraction \(P(k)\) of nodes having \(k\) connections to other nodes follows a power-law distribution: \(P(k) \sim k^{-\gamma}\), where \(\gamma\) is a scaling parameter.
This implies that, while in homogeneous graphs the degree of all nodes is roughly the same, in scale-free networks most nodes have a small degree, and a few nodes have a very high degree.

2. Graph Model
The authors investigate the Erdős–Rényi graph, which produces graphs with a homogeneous degree distribution—specifically, a Poisson distribution. In this model, \(N\) nodes are defined, and each pair of nodes is connected with a probability \(p\).
They also study real-world networks using a scale-free model. This model operates with the following algorithm:
The network starts with \(m_0\) nodes. At every time step \(t\), a new node is introduced and connected to \(m\) of the existing nodes. The probability of connecting to a node \(i\) depends on its connectivity \(k_i\). In other words, the probability is given by \(\Pi = \frac{k_i}{\sum_j k_j}\), where \(\sum_j k_j\) is the total degree of the network.
3. Metric
The connectivity of a graph can be described by its diameter \(d\), defined as the average length of the shortest path between any two nodes. A smaller \(d\) indicates shorter expected paths between nodes.
For example:
- The World-Wide Web, with over 800 million nodes (as of July 2000), has a diameter of 19.
- Social networks, with over six billion individuals, have a diameter of approximately 6.
This implies that starting from any person in such a social network, it would take about 6 steps to reach any other node.
4. Method
To evaluate the resilience of these networks, the authors analyze how the diameter \(d\) changes when a small fraction \(f\) of nodes is removed. This fraction is referred to as the error rate.
Additionally, to simulate deliberate attacks, they consider scenarios where an attacker removes nodes with the highest connectivity first, continuing to select and remove nodes in decreasing order of their connectivity.
5. Results
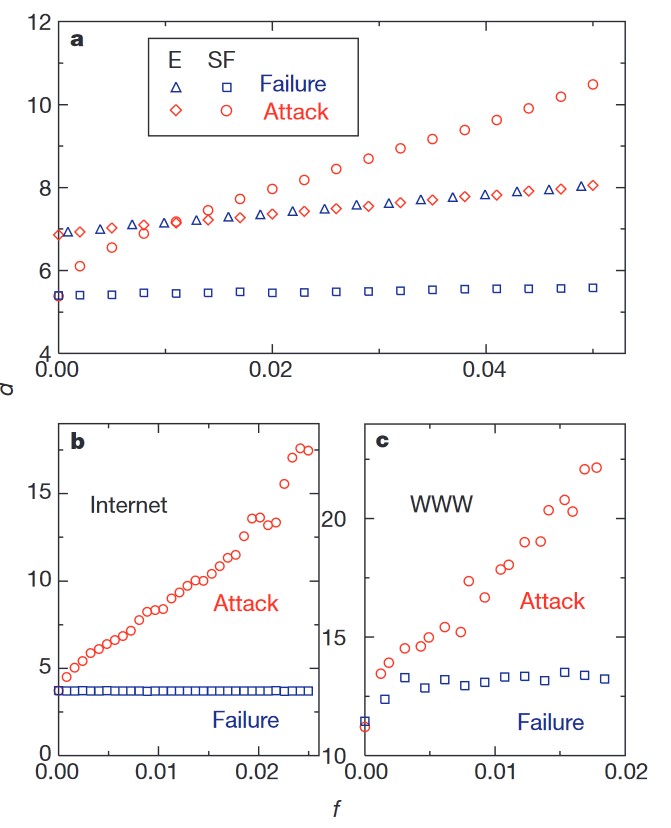
For exponential (homogeneous) networks, the authors find that the diameter decreases at the same rate as the error rate \(f\).
This is intuitive because, in homogeneous networks, all nodes contribute equally to connectivity. Removing any node results in equal damage to the network’s diameter.
In contrast, for scale-free networks, the diameter remains mostly unchanged even as more nodes are removed. For example, even if 5% of all nodes fail, communication within the network is largely unaffected.
This robustness can be attributed to the inhomogeneous connectivity of scale-free networks. Randomly removing a node is far more likely to impact nodes with few connections rather than the few highly connected nodes, which are sparse.
Under targeted attacks, the results differ significantly. For exponential networks, there is no substantial difference in the diameter when nodes are removed randomly compared to deliberate removal.
However, in scale-free networks, targeted attacks are much more effective. When just 5% of the most connected nodes are removed, the diameter doubles, significantly impairing communication.
This is because, in scale-free networks, the connectivity distribution is highly inhomogeneous. A small number of nodes have very high connectivity, and their removal has a disproportionately large impact on the network’s structure.

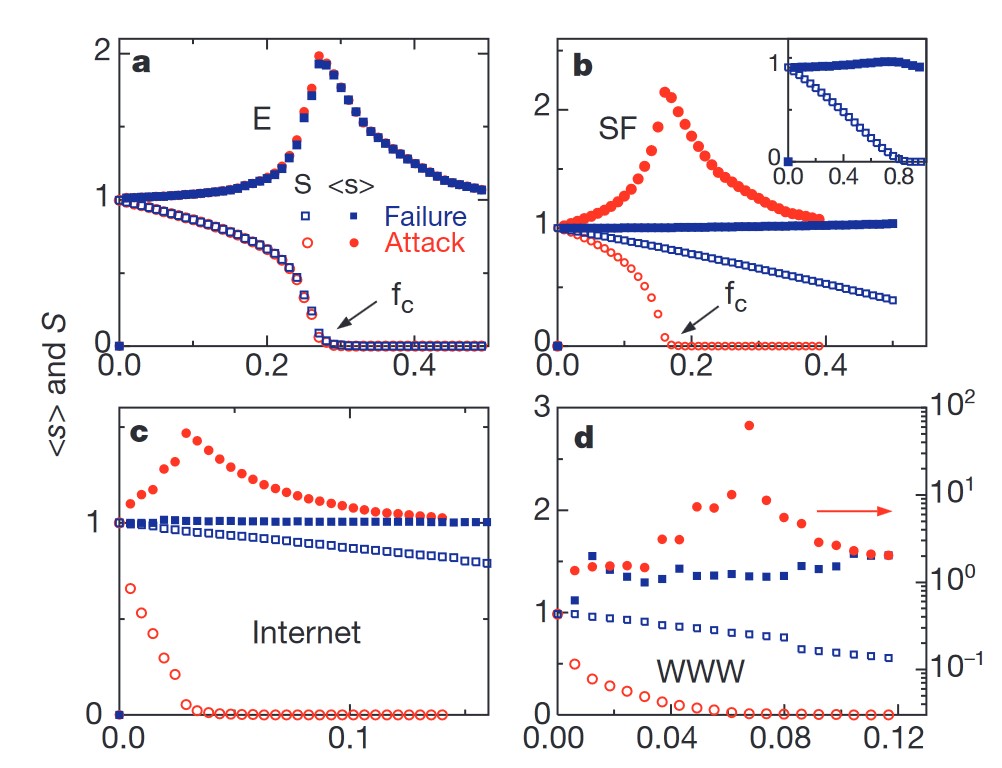
Another metric the authors use is the size of the largest cluster \(S\), measured as a percentage of the total network size.

6. Conclusion
The authors find that scale-free networks are surprisingly robust against random node failures, a property not shared by homogeneous network types. However, scale-free networks are significantly more vulnerable to targeted attacks that remove highly connected nodes.
The authors suggest that this robustness to random failures is why server or router failures in real-world systems rarely lead to total Internet outages.
This inherent topological weakness of inhomogeneous networks, however, can be exploited by attackers to reduce network survivability.
