Tearing Down the Internet
November 16, 2024 | 1,563 words | 8min read
Paper Title: Tearing Down the Internet
Link to Paper: Read the paper
Date Published: 2003
Paper Type: InfoSec, Internet, Cybersecurity, Resilience, Topology
Short Abstract:
The internet becomes increasingly vital each day, making downtime or disruption potentially catastrophic. It is therefore important to investigate the resilience of the internet against hacker attacks. This paper explores how many nodes would need to be targeted to significantly disrupt the functionality of the internet.
1. Introduction
Between 2000 and 2001, there was a 33% increase in internet users. Sooner or later, everyone will be connected to the internet. As a result, messages like “The host is unreachable” are becoming increasingly unacceptable, with connectivity failures leading to massive profit losses for corporations.
This growing dependence makes the internet a prime target for terrorist attacks. While the internet is comprised of many layers, attacks on the lower layers affect all the layers above. Therefore, the authors focus on the internet protocol (IP) layer, examining how it can be attacked and the resulting consequences.
2. Previous Works
The first major study in this area was published in 2000 by Albert, who investigated the effects of random node removal. Their work involved both generated and measured graphs. They used the autonomous system (AS) level to map the structure of the World Wide Web.
To measure the impact of attacks, they used metrics such as:
- Diameter of the network
- Size of the largest cluster
- Average size of isolated clusters
In 2001, Tauro conducted similar work, using the same metrics and AS-level network topology.
That same year, Palmer examined the robustness of routers through random edge deletions and targeted node deletions. By collecting data to create a router-level map, Palmer used metrics such as the number of reachable node pairs and the hop exponent.
Many of these earlier studies produced similar results to those found in this paper.
The authors of this paper position their work as an extension of these prior studies, focusing on determining the conditions necessary to destroy the functionality of the internet.
3. Internet Maps
To study how the internet reacts to attacks, the authors needed a graph to test these attacks.
3.1 Sources
The authors focus on IP-level maps rather than AS-level maps. The sources they used include:
- Router-level maps derived by merging data from:
- The SCAN project
- The Lucent Internet Mapping project from the 1990s
- Router-level maps from LSIIT using Mercator software (2002):
- Includes IP addresses of router interfaces
- AS-level maps collected by route-views
3.2 Building the Map
The authors constructed a topological overlay that relates the router-level maps to the Autonomous System (AS)-level map.
To build this overlay map, they directly mapped the routers identified by Mercator to the ASes found in the BGP table. The BGP routing table used was sourced from route-views created in 2002.
During the construction process:
- Each IP prefix from the BGP table was associated with its advertising AS.
- If an IP prefix was associated with multiple ASes, they retained the first AS found.
- Mercator assigned the IPs to the multiple interfaces of a router.
The resulting map contained:
- 20,385 interfaces
- 188,347 nodes
- An average node degree of 2.5
The authors acknowledged that their map likely missed many redundant links.
Unresolved interfaces were assigned to AS number 0.
Finally, for each router IP:
- They searched for its AS number using its associated interfaces and Mercator.
- If a router had multiple interfaces, they used the interface with the lowest IP address.
Thus, every router in the map was assigned both an IP address and an AS number.
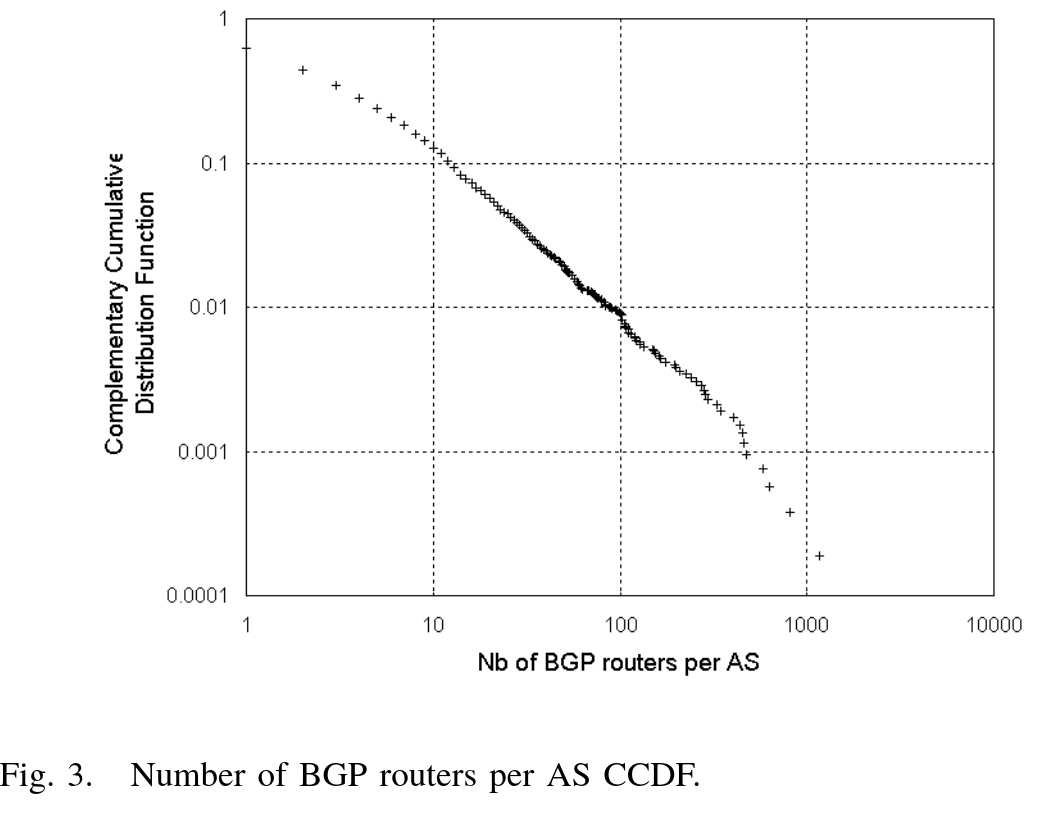
The overlay was then used to identify potential BGP routers. They found 40,316 potential BGP routers, representing 21.4% of the topological map.
3.3 Assessing the Accuracy of Their Constructed Map
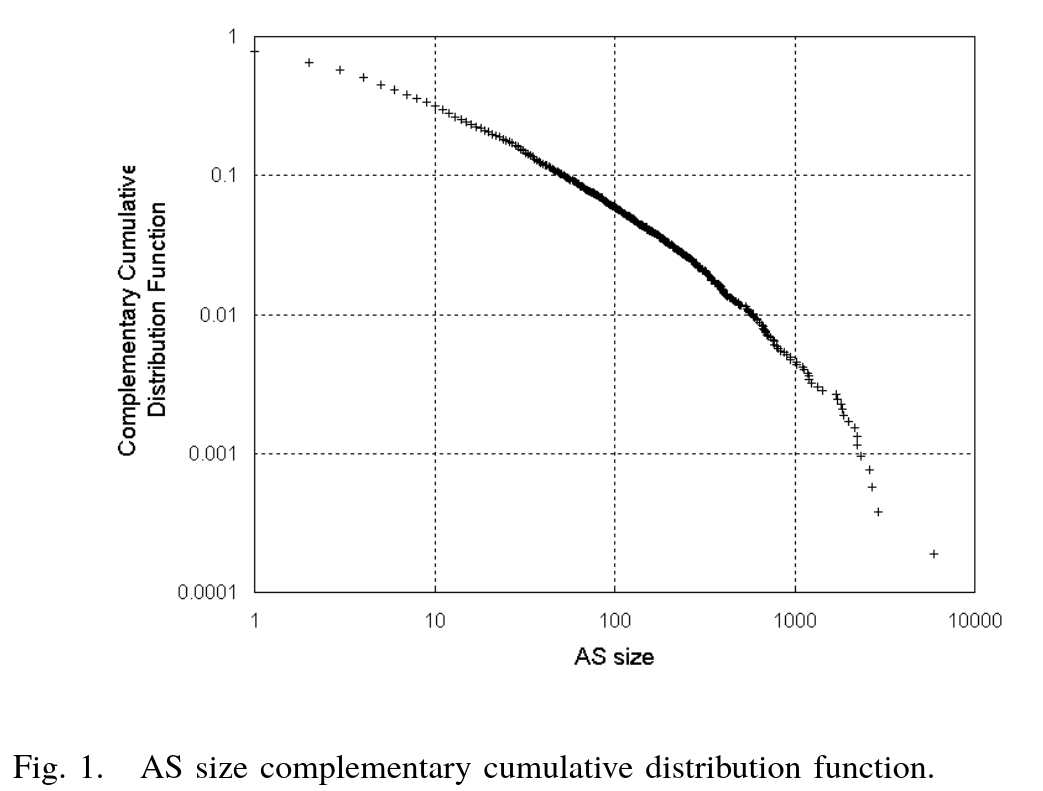
To evaluate the accuracy of their constructed map, the authors examined the size distribution of ASes: 5,277 ASes contained one or more routers, representing 39% of all nodes.
This indicates that their map is incomplete.
Additionally, studying the number of BGP connections revealed similar flaws: 23.6% of connections were filled, while the rest were empty.
This shows a significant lack of IP links.


4. Attack Techniques
4.1 Limitations
The authors identify the following limitations in their work:
- Their map is incomplete and flawed.
- Router maps produced by Mercator may include virtual IP nodes and links, as backbone service providers simulate different virtual topologies for security purposes.
- They measure the destruction of the network quantitatively. For example, if a popular node is disconnected, many users might complain, even though 90% of the internet is still reachable.
4.2 Overview
Instead of studying random node or link failures, the authors focus on targeted node removal.
In a graph model, the removal of a node deletes all its adjacent links. However, in reality, node removal would not involve physically cutting wires or destroying devices. Instead, it would resemble a distributed denial-of-service (DDoS) attack, rendering the node useless without destroying it.
The study aims to determine the most efficient way to minimize the number of nodes required to be removed to disrupt the network. The authors do not investigate how these node removals would be executed in the real world.
4.3 Method
The authors distinguish between two attack techniques: static and dynamic attacks.
In static attacks, each node is assigned a fixed importance value, and nodes are removed from the network one by one in decreasing order of importance. This method is computationally faster compared to dynamic methods.
The importance of nodes can be determined using one or more of the following metrics:
- Degree
- Root
- Mesh
- Cutpoint
- Average distance
If two nodes have the same importance using a single metric, multiple metrics can be combined to break the tie.
In dynamic attacks, each node is initially assigned an importance value. After each node removal, the importance values of remaining nodes are recalculated. Examples of importance metrics for dynamic attacks include:
- Largest connected component
- Degree
- Cutpoint
Dynamic methods are better than static methods at identifying and removing important nodes. However, they are slower to compute.
5. Experiments
Their experiments show that static and dynamic attacks produce very similar results. In the paper, they only present results that are not too similar to avoid redundancy.
5.1 Metrics
Quantifying connectivity in a network is challenging, as no single metric can capture all aspects. Some possibilities include:
- Average length of the shortest path between any two nodes:
- This does not indicate if two nodes can no longer communicate.
- Diameter and average distance:
- These metrics do not provide information about the actual loss of connectivity between nodes.
- Average size of isolated clusters:
- Cluster size distribution can be highly erratic.
The authors focus on the size of the largest connected component as a metric, as it provides an upper bound on the number of nodes that can communicate.
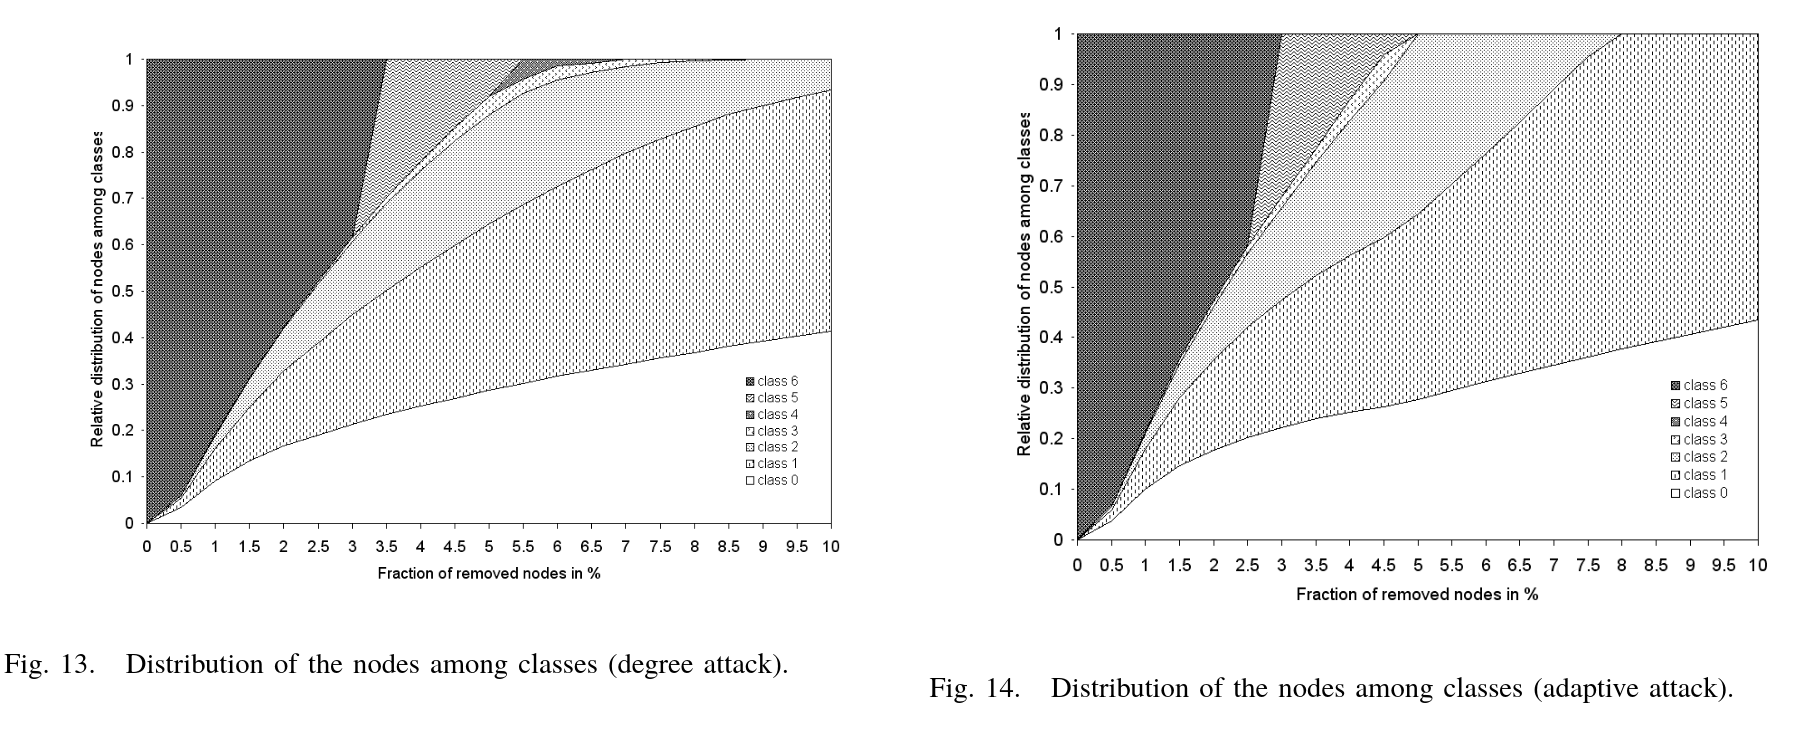
To classify clusters based on their size, they define the following classes:
- Class 0: 1 node
- Class 1: 2–10 nodes
- Class 2: 11–100 nodes
- Class 3: 101–1,000 nodes
- Class 4: 1,001–10,000 nodes
- Class 5: 10,001 or more nodes
This class system provides a concise representation of cluster sizes.
To compute the connected components, the authors use a modified version of Tarjan’s algorithm for undirected graphs.
For deeper insights into network fragmentation, they also analyze the distribution of relative node numbers per class—i.e., the fraction of total network nodes in each class. This metric answers questions such as:
“What is the probability that a node can communicate with at most a given number of other nodes for a given percentage of node removal?”
5.2 Core Robustness Behavior
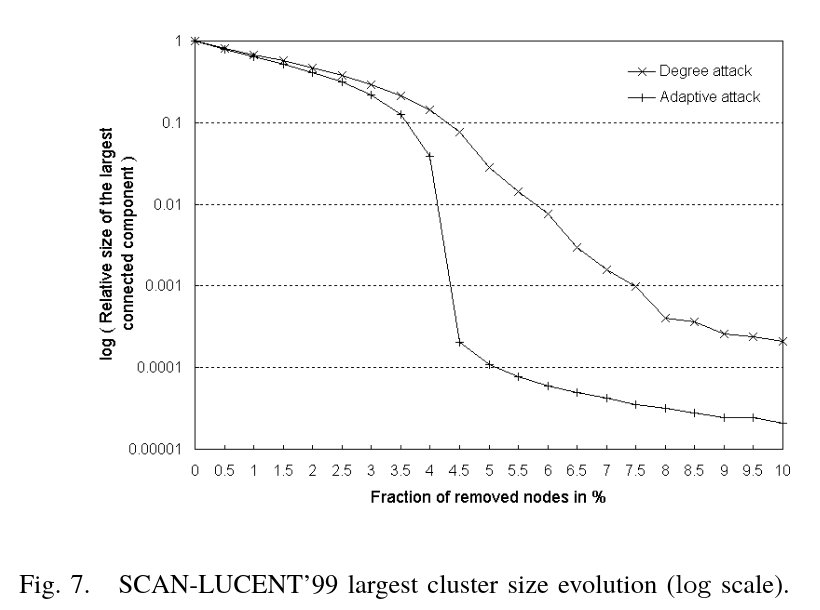
Figure 5 illustrates the evolution of static attacks using the degree metric and adaptive attacks using the largest connected component and degree metrics.
From the figure, we observe that removing just 5% of the nodes renders the network essentially non-functional, with negligible connectivity remaining.

5.3 Distribution of Nodes
At 8% node removal under an adaptive attack, only Class 0 and Class 1 components remain in the network.

5.4 Destruction Level
To ensure no components in the LSITT02 map contain more than 100 nodes, 4% of the nodes in the network must be removed.
Extrapolating this to the entire internet in 2002 (approximately 200 million hosts), 14.8% of the routers would need to be removed to reduce all components to Class 2 or smaller. This translates to attacking about 300,000 routers.
The authors define three levels of destruction in the table below, indicating how many routers must be attacked to achieve a given destruction level.

6. Conclusion
The authors demonstrated that removing 4% of the routers using an adaptive attack leaves the network fragmented into clusters with no more than 100 routers each. Furthermore, removing just 1.5% of the nodes reduces the size of the largest cluster in the network by half.
Bringing down the internet entirely would require simultaneous attacks on hundreds of thousands of routers—a scale that is practically infeasible with current technology and resources.
My Own Thoughts
Bringing down the entire internet might be impossible due to the sheer number of nodes that would need to be attacked. However, the percentages scale down when applied to smaller networks.
I wonder how feasible the same attack strategies discussed in this paper would be against overlay networks like Tor, I2P, or HyphaNet. These overlay networks have significantly fewer nodes, which could make it feasible to attack a sufficient number simultaneously to cause major disruption.
For reference, see this example: Tor DDoS Attack.
